

Note: The data presented is based on the Sweetbeat app.
HRV is a snapshot inside of us by measuring the health of our nervous system and stress, which has implications for our overall health. Specifically, HRV shows the balance or lack thereof between our sympathetic (flight-or-fight state) and parasympathetic (rest and digest, relaxed state).
HRV “tests” our heart beat rhythms and variance between heart beats to reach a conclusion and final score. Unlike resting heart rate, we actually want a high HRV number generally, as this shows a robust nervous system and good health. Those who are very stressed out will see chronically low HRV scores due to spending too much time in a flight-or-fight state without appropriate recovery. This is when we can intervene and bring more balance and rest into one’s life.
However, signs of being in a high sympathetic state aren’t always bad.
LF vs. HF
The sympathetic state is the low-frequency (LF) domain on the app, while your parasympathetic state is the high-frequency (HF) domain. Generally, we don’t want the LF (sympathetic) to be a ton higher than our HF, nor chronically higher than the HF; especially, if testing when in a rested state when HF should be “turned on.”
As a rule of thumb: the LF/HF ratio is <2 in healthy people. This is where you want to be and it’s worth observing and tracking this number.
If the LF looks really high, and much higher than HF, that usually indicates an athlete is in need of more recovery, rest, and/or stress management because they’re sympathetic dominant and in need of some parasympathetic activation.
When High LF is OK
However, there are cases in which a high LF is a good thing! A strong LF coming off a rest day could show a robust system and that your body (and adrenals) are ready for action. This is “good stress” and/or coherence (which we will get to next).
“Short-term elevation of LF can be a sign of good stress,” says SweetWater Health CEO Ronda Collier. “If you are at or below an LF/HF ratio of 2 you are OK.”
Q: How do you determine if a high LF is ok and/or the stress you’re seeing is “good” stress?
- If the LF/HF ratio is still <2.
- If the elevated LF is only short-term and not chronically elevated (this obviously will require consistent HRV tracking and watching trends).
Examples:
“Bad” stress state
LF 6,500 and HF 1,900; HRV 82 average. A pretty good HRV but the LF/HF ratio is 3.4. This is not a good sign. Rest, recover, meditate and get back to balance.
“Good” stress state
LF 15,000 and HF 8,000; HRV 90. LF/HF ratio is 1.8. This is acceptable and a sign to go get at it!
Q: So what if the LF/HF ratio is more than 2?
This doesn’t necessarily mean your world is crashing down. “If it is temporary, not to worry. If [the ratio is often or always over 2] this is a sign of chronic stress,” says Collier.
So when looking at your numbers it’s crucial to look for trends, red flags, and/or green lights. Each HRV score and LF/HF ratio should not be viewed in isolation, for the most part.
Coherence’s role
It doesn’t end there. We also need to be aware of something called coherence. Having coherence is a good thing; however, it is technically a spike in frequencies indicated in a powerful (high) LF and very low HF. What!? I thought we didn’t want a high LF and low HF due to that equaling a ratio greater than 2?! I know, it’s confusing. Don’t worry about the science of this too much, as it can get complicated.
To understand coherence, it’s best to use visuals. We can determine coherence vs. non-coherence using the app’s graphs. Coherence can be detected as 1) a sine wave-looking heart rate and 2) verified by noting a high LF and a very low HF (if you know what you’re looking for). For Sweetbeat users, you can use HeartMath to better understand.
So, how can you tell if you are coherent? The easiest way is to look at your heart rate graph. If it looks like a sine wave then you are likely coherent! Here is an example of a non-coherent heart rate graph (Figure 1; top) and a coherent heart rate graph (Figure 2; bottom) that is displayed in real time in SweetBeatHRV.
Figure 1 – Non-coherent while working at a desk.
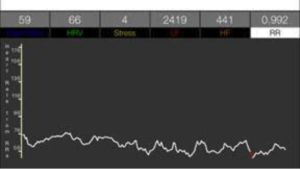
Figure 2 – Coherent while meditating.
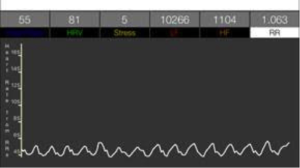
Note the LF vs. HF in each. In Figure 2 there’s a 9.2 ratio! But in this case we know the situation is ok because of the nice, even graph. If you meditate you may see the sign for “high stress,” but just be sure to analyze the graph to get to the bottom of it. Furthermore, look at the low numbers in the non-coherent state, which aren’t good even though the LF/HF ratio is much lower (5.4).
Need more coherence? The best “hack” to induce coherence is deep-breathing work and meditation.
For more info
Refer to Sweetbeat’s HRV 101 slides for average LF, HF and HRV data to better decide how you stack up compared to elite athletes, your age group, and the general population. Where do your scores fall—are they high, low, average? And how consistent are you? What trends do you see, especially as it relates to training and lifestyle? Can you get into a coherent state or are you “all over the place” non-coherent?